您现在的位置是:首页 >技术杂谈 >基于VMD-CPA-KELM-IOWAl-CSA-LSSVM碳排放的混合预测模型研究(Matlab代码实现)网站首页技术杂谈
基于VMD-CPA-KELM-IOWAl-CSA-LSSVM碳排放的混合预测模型研究(Matlab代码实现)
简介基于VMD-CPA-KELM-IOWAl-CSA-LSSVM碳排放的混合预测模型研究(Matlab代码实现)
??个人主页:研学社的博客
????欢迎来到本博客❤️❤️??
?博主优势:???博客内容尽量做到思维缜密,逻辑清晰,为了方便读者。
⛳️座右铭:行百里者,半于九十。
???本文目录如下:???
目录

?1 概述
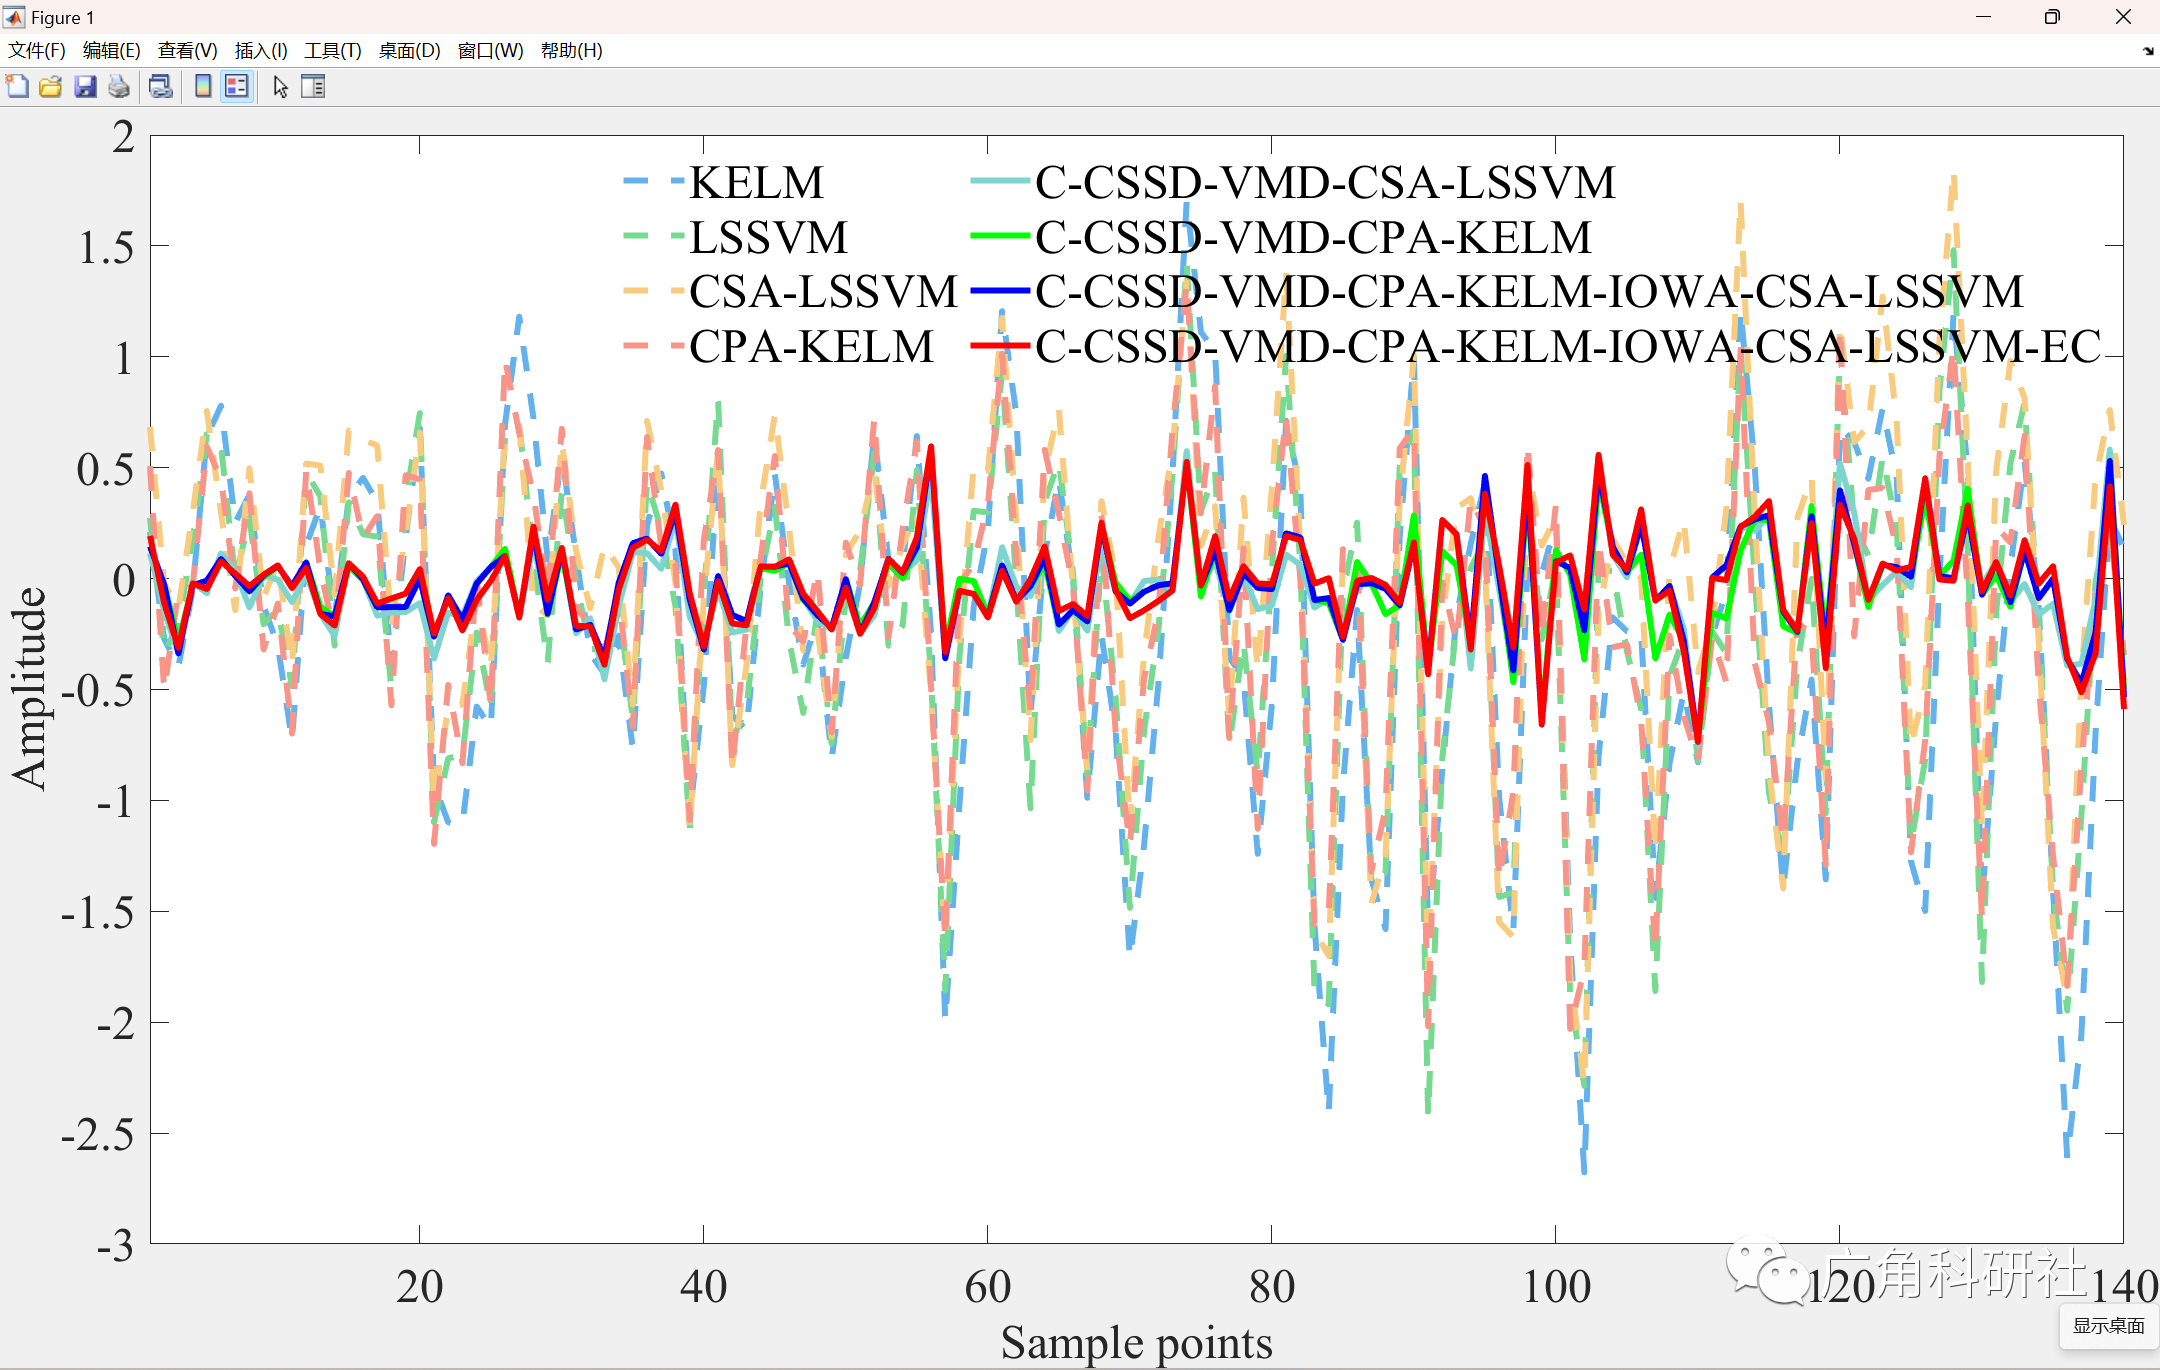
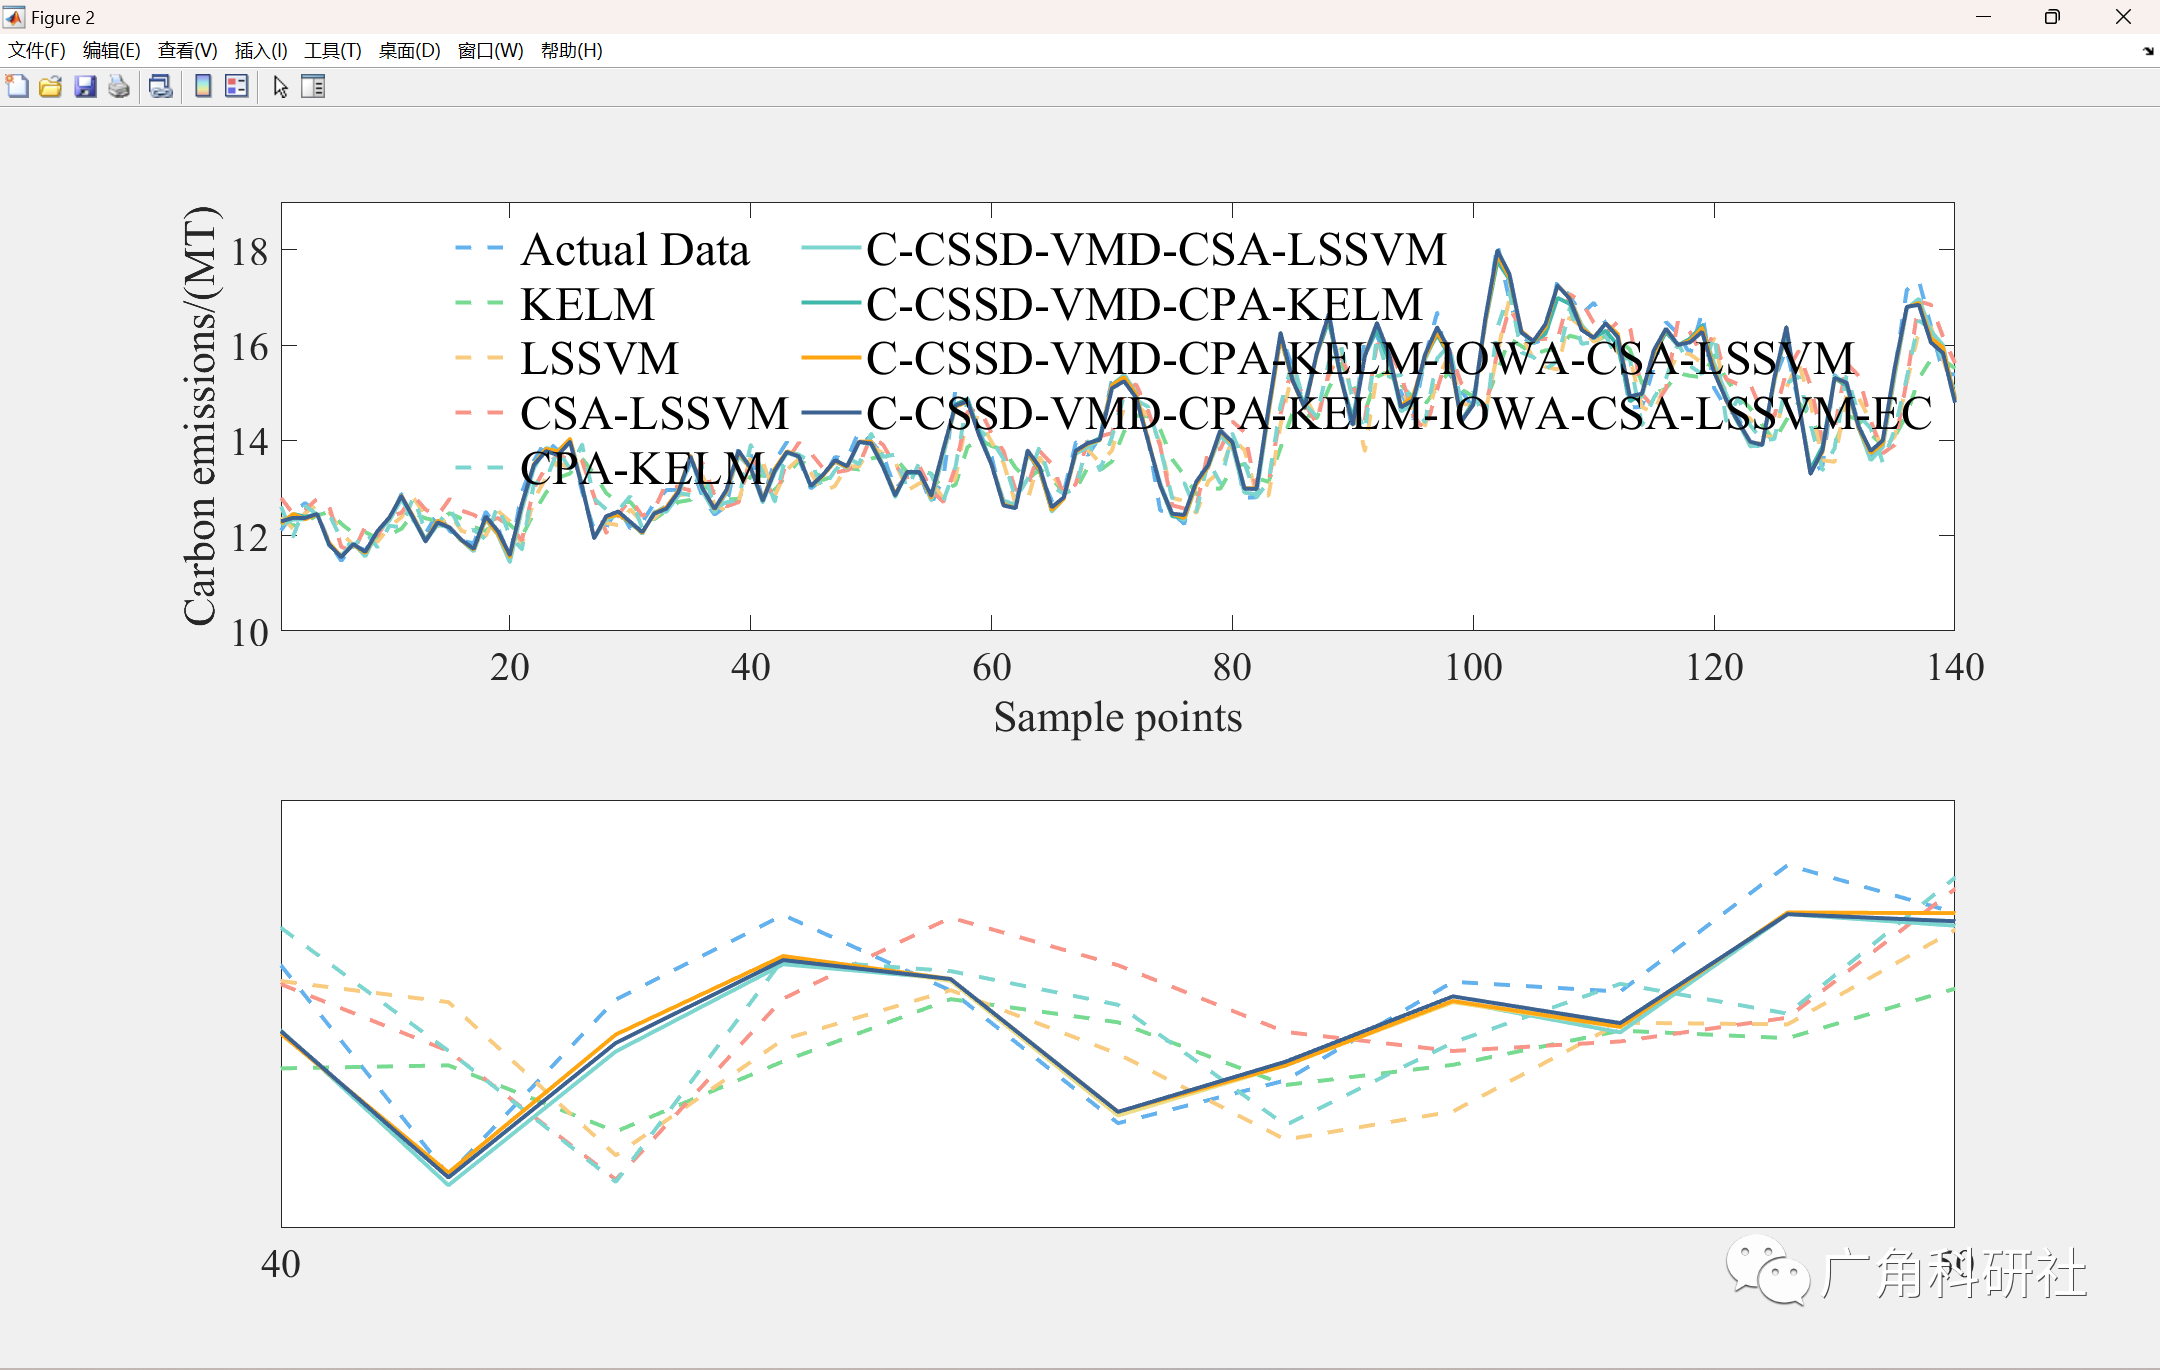
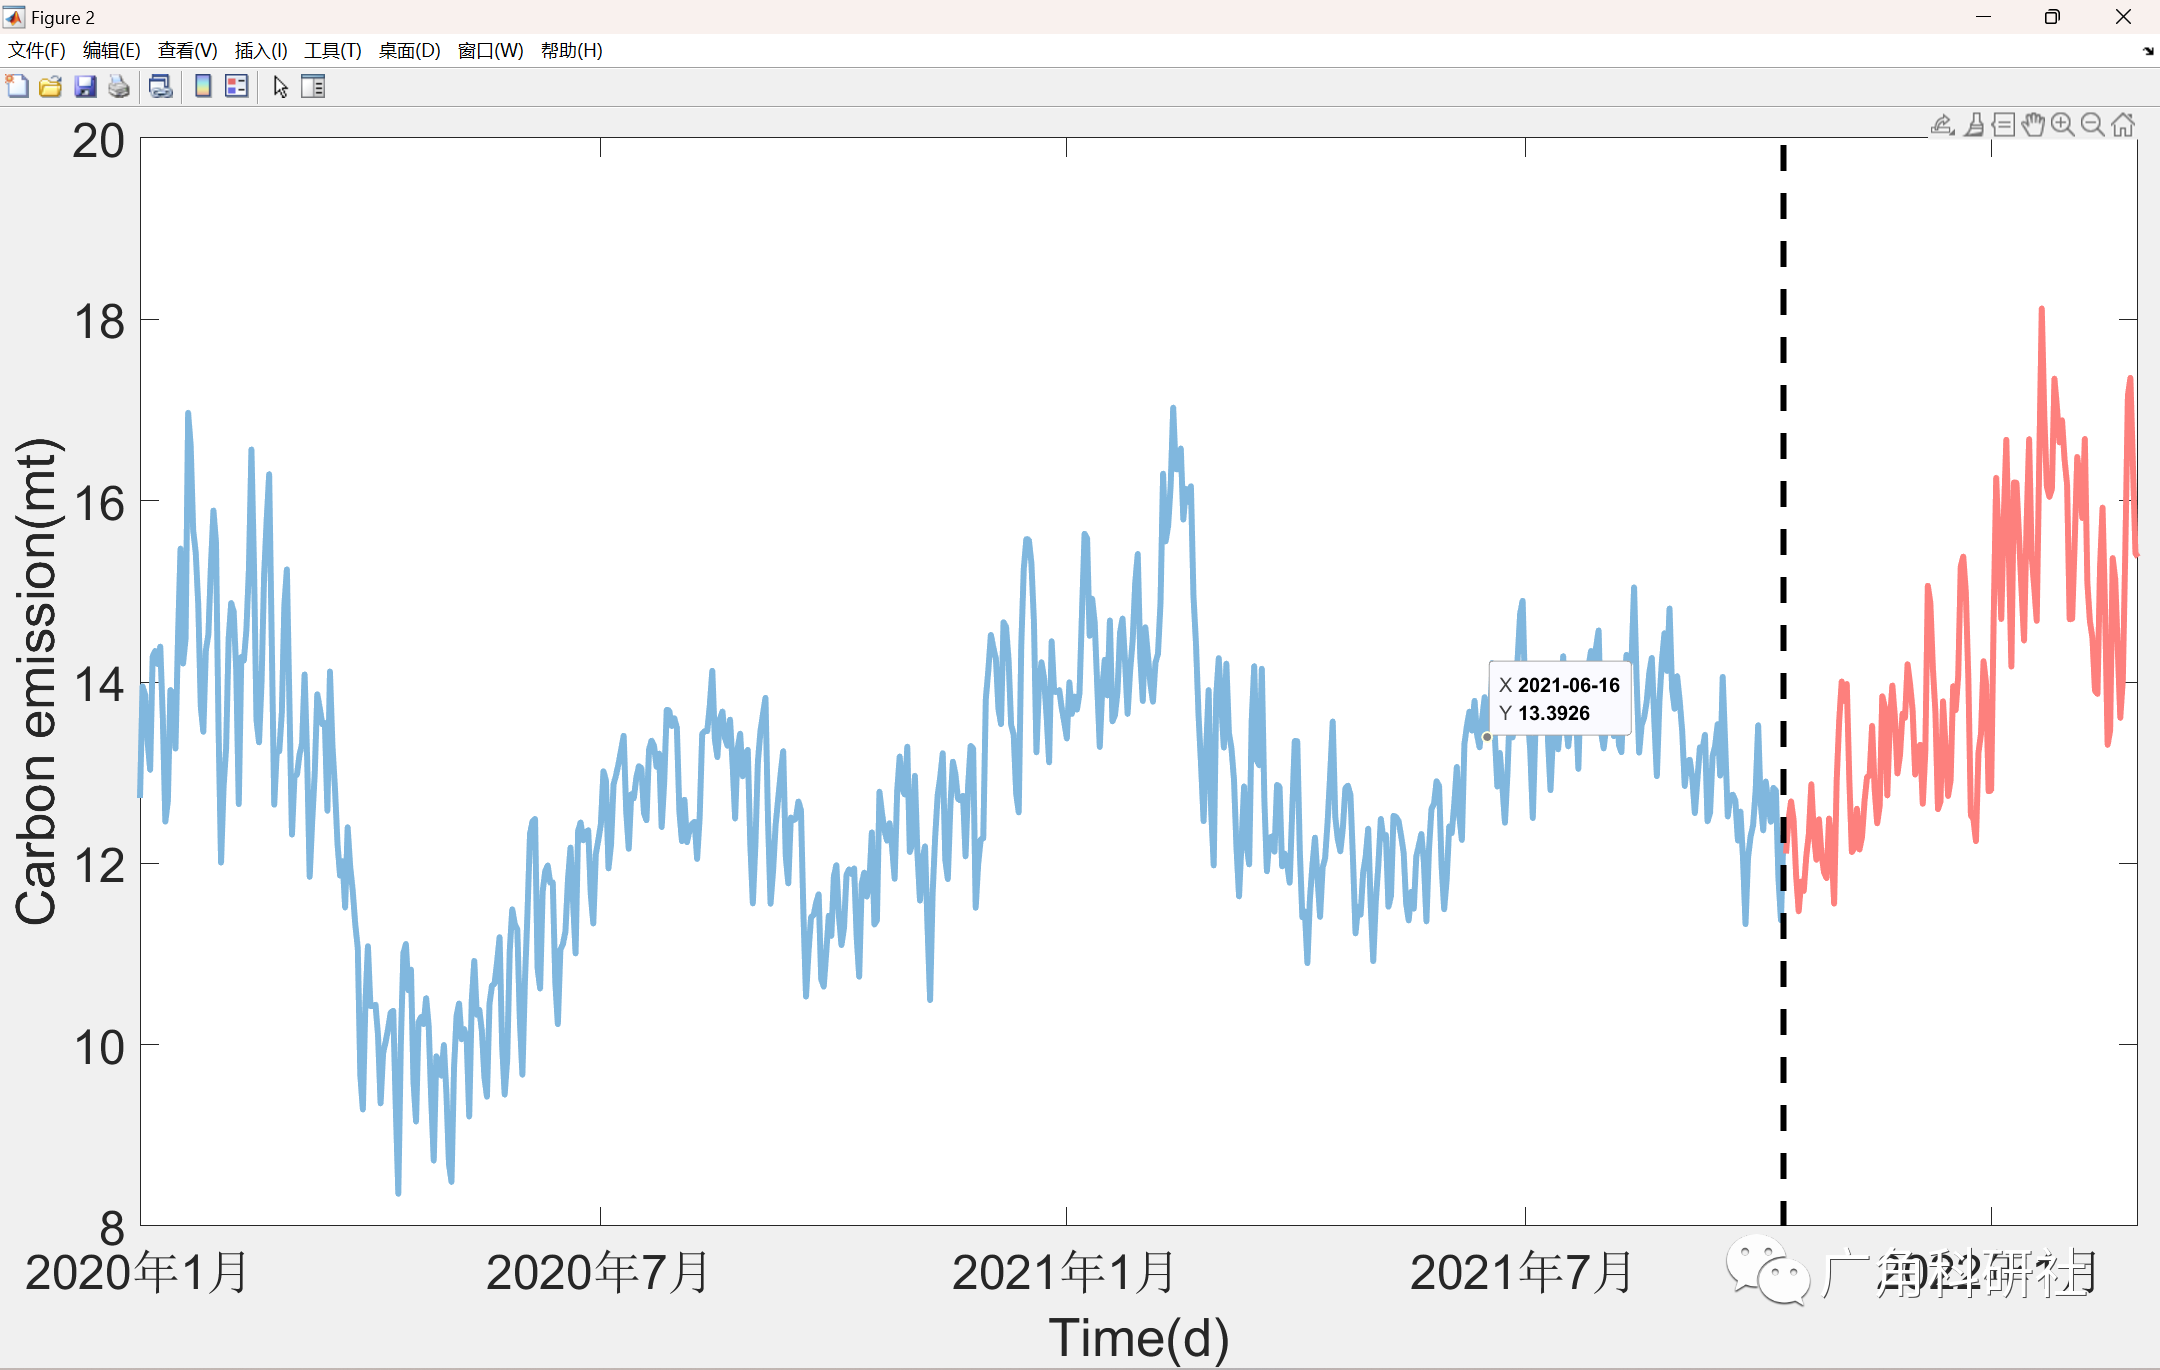
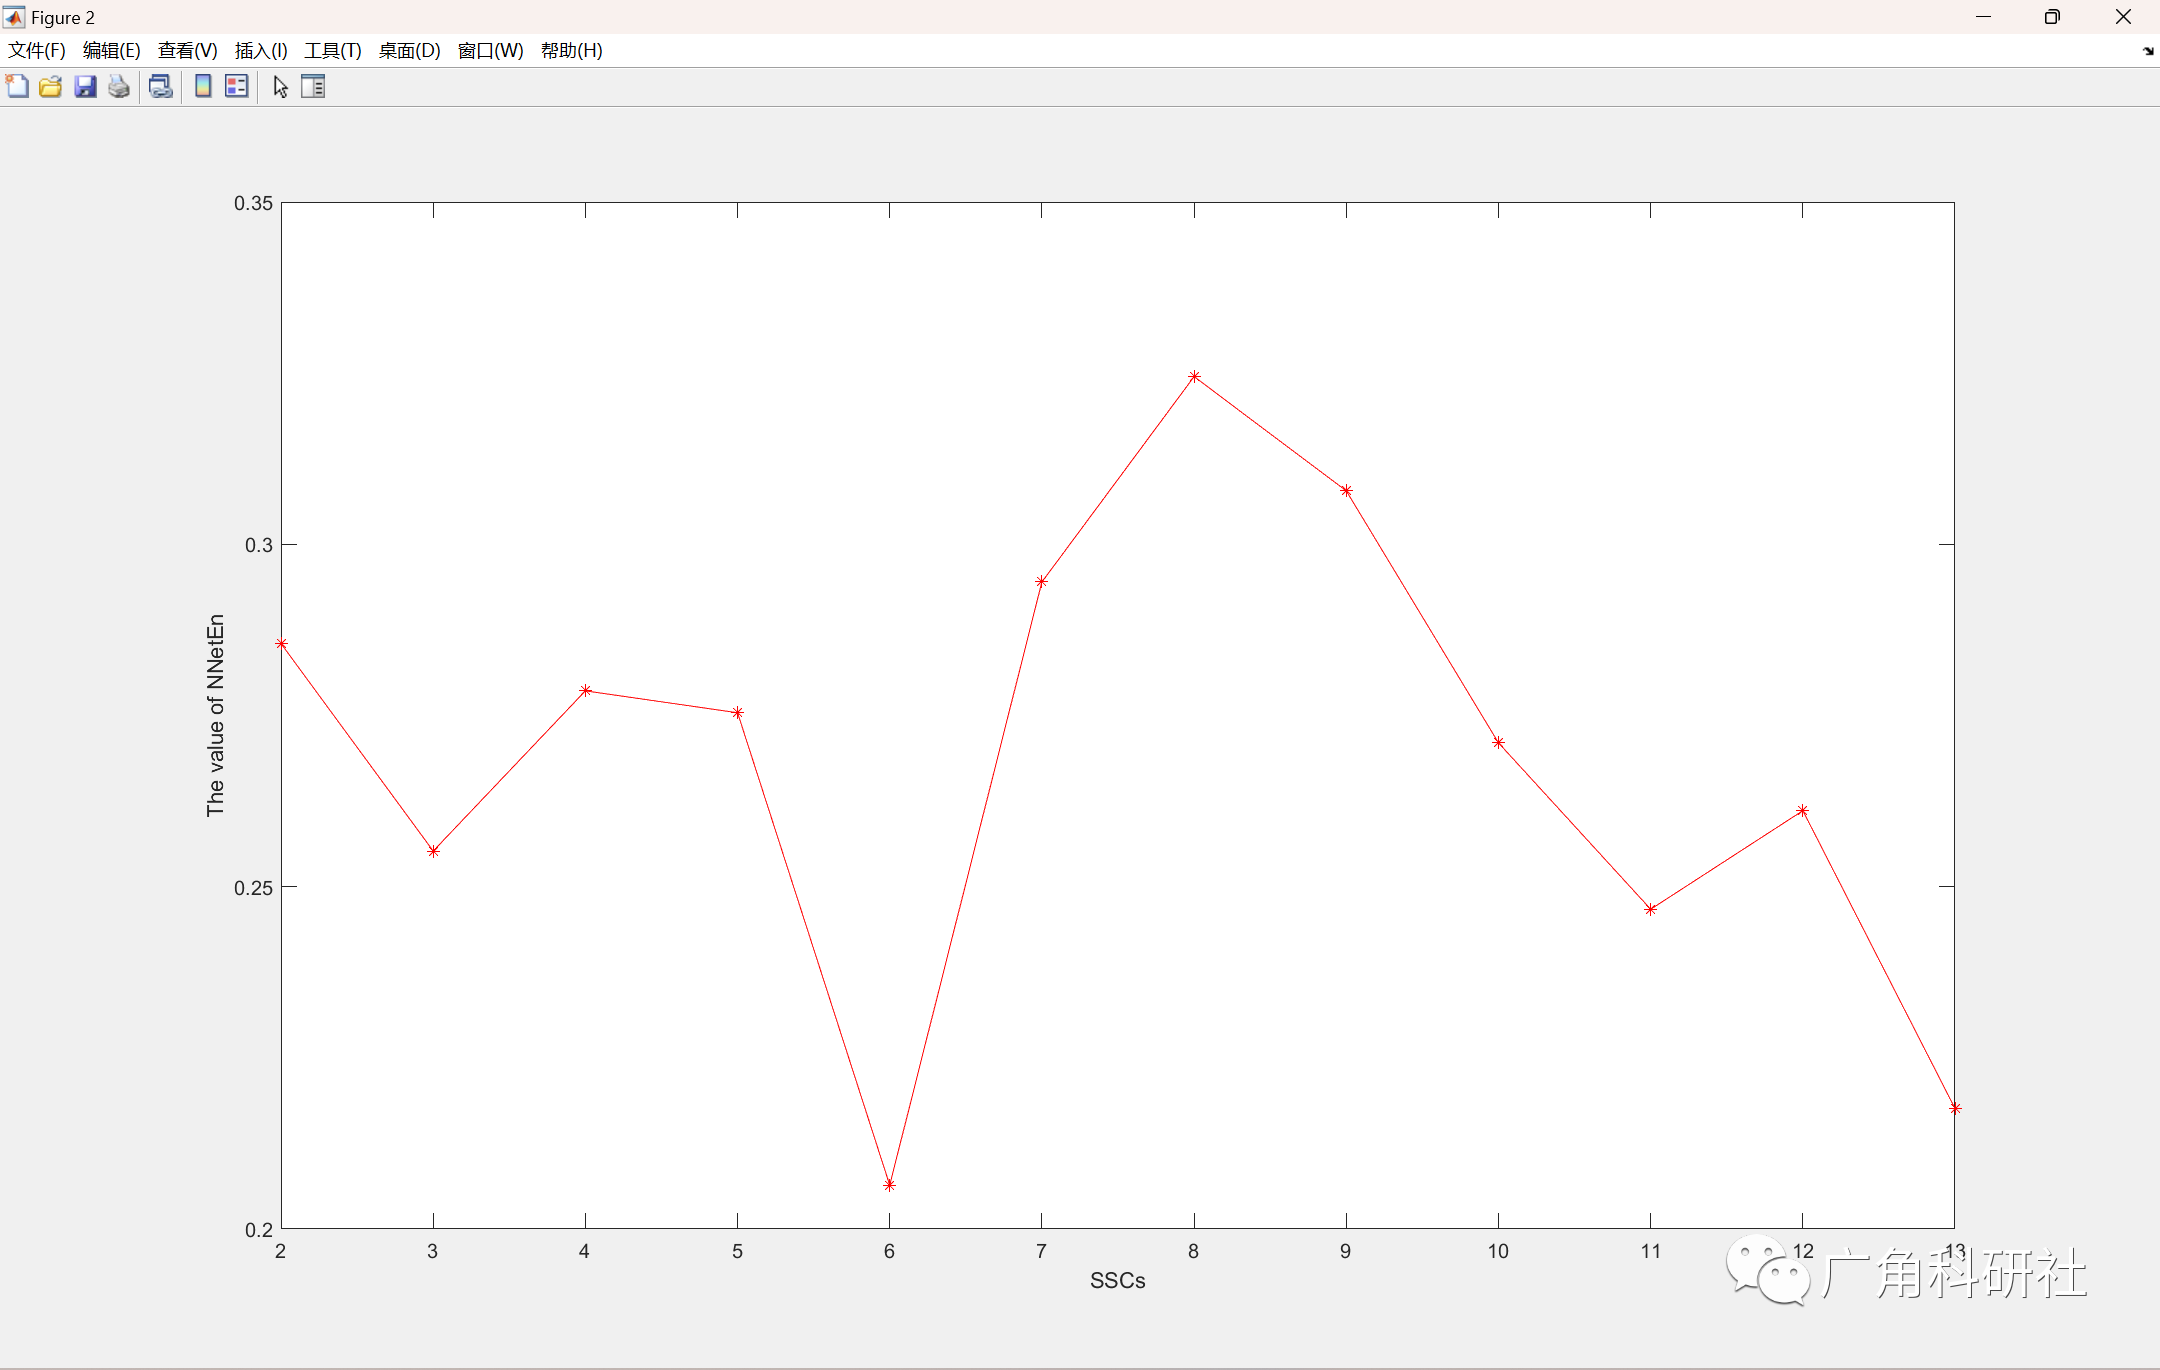
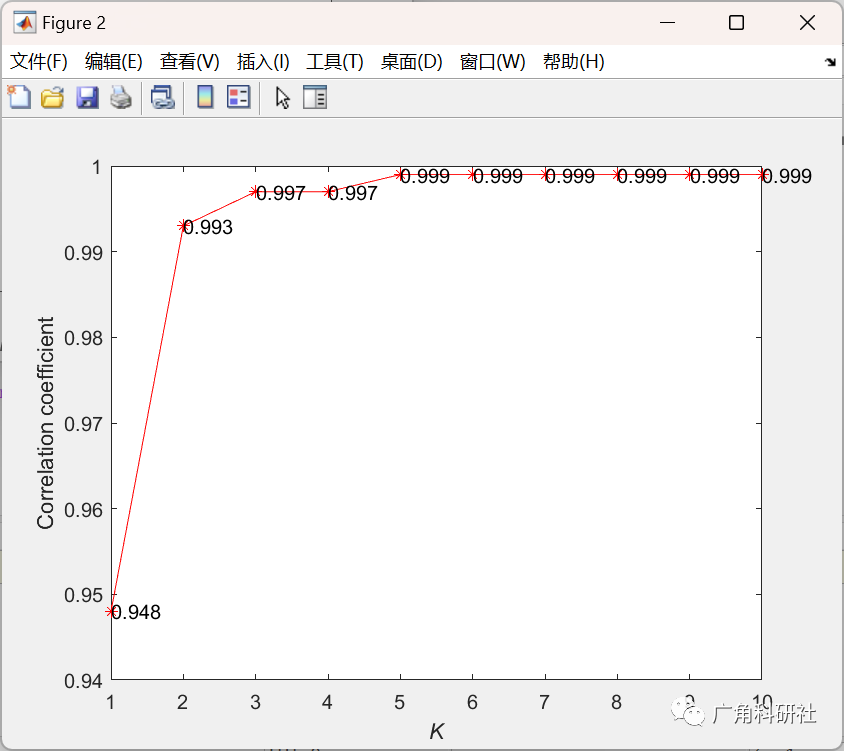
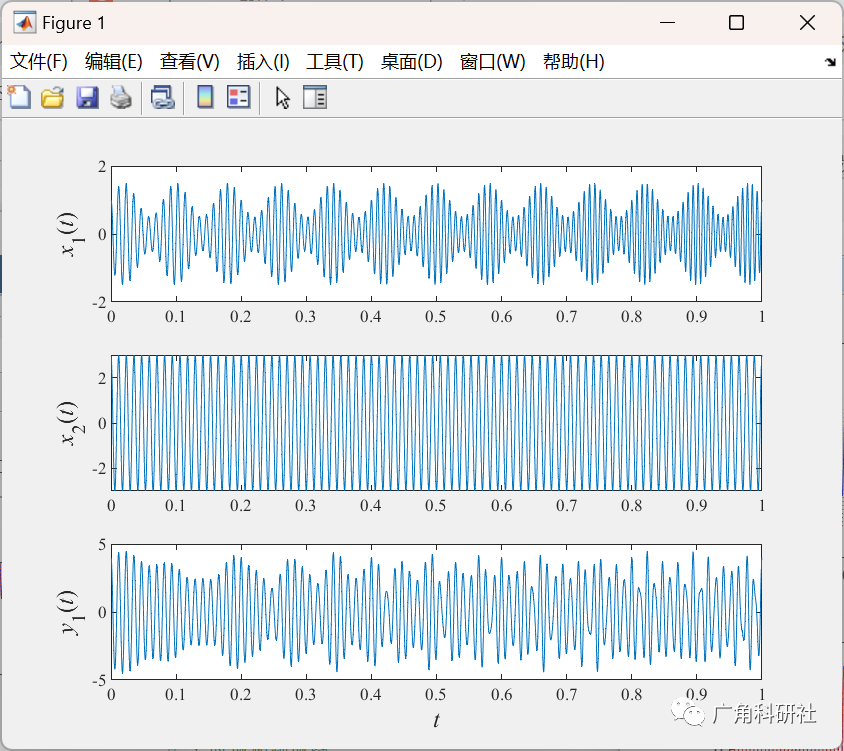
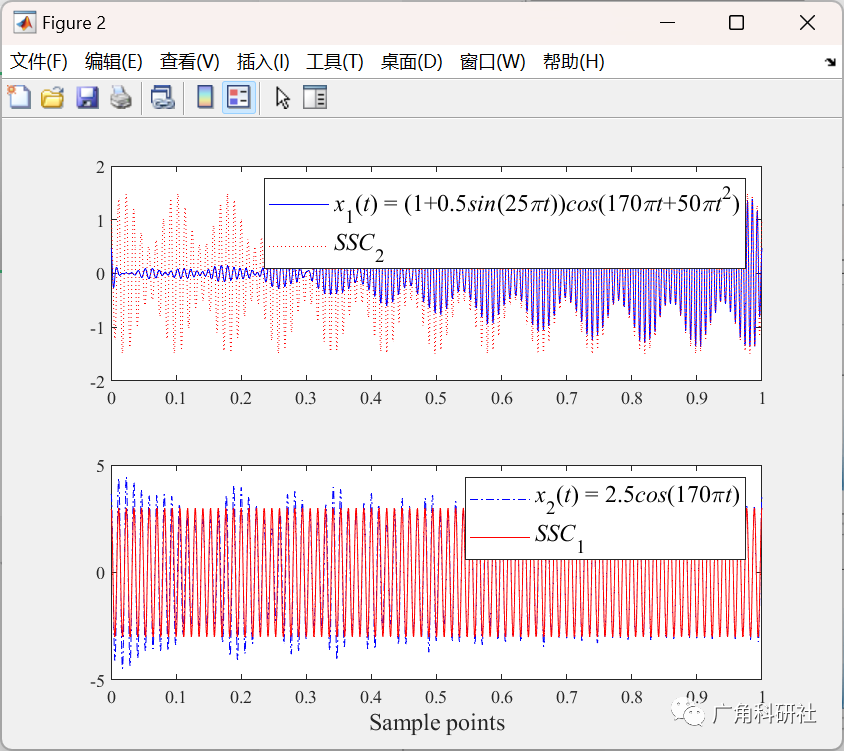
作为温室气体的主要成分,二氧化碳排放量的增加导致全球变暖,对人们的生活和发展产生直接而持久的负面影响。建立准确的碳排放预测模型对人类健康和生态环境保护至关重要。本文针对碳排放数据高度复杂的问题,建立基于相关积分和相关维数的奇异谱分解(SSD)、神经网络估计时间熵(NNetEn)、变分模态分解(VMD)、食虫植物算法改进的核极限学习机(CPA-KELM)、变色龙群算法改进的最小二乘支持向量机(CSA-LSSVM)等碳排放组合预测模型, 提出了诱导有序加权平均(IOWA)运算符和纠错(EC),命名为C-CSSD-NNetEn-VMD-CPA-KELM-IOWA-CSA-LSSVM-EC。
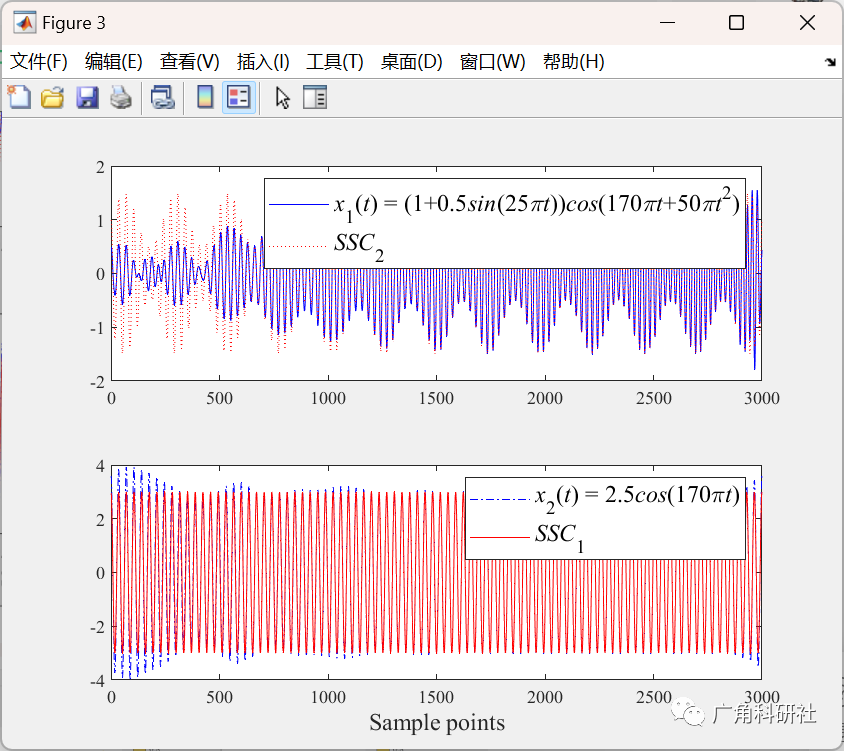
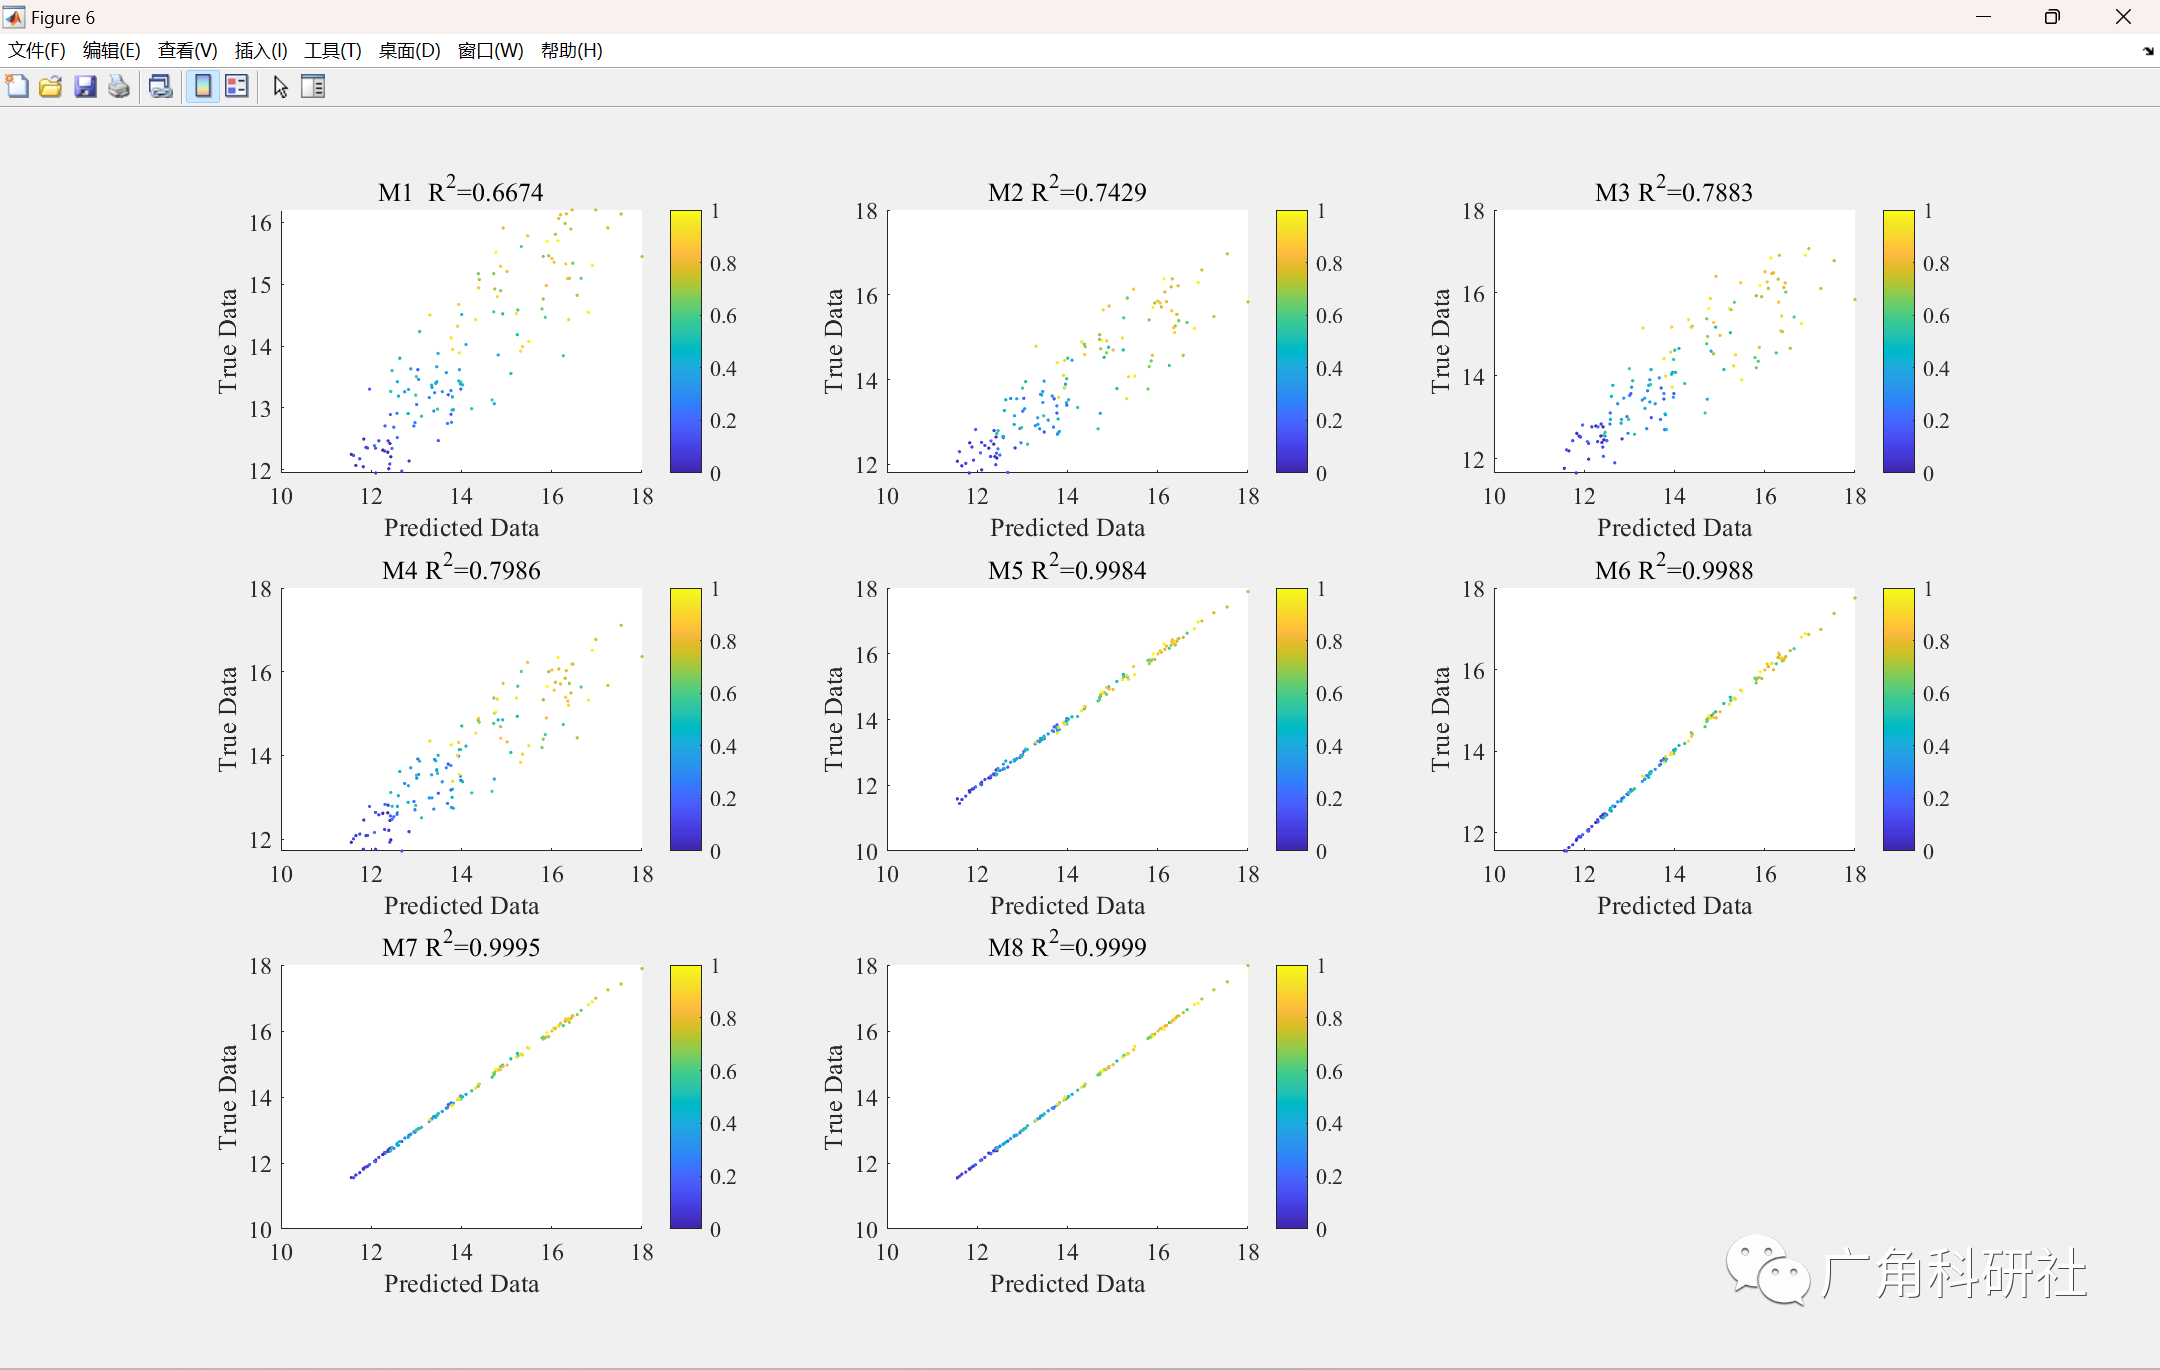
?2 运行结果
主函数部分代码:
clc;clear;close all
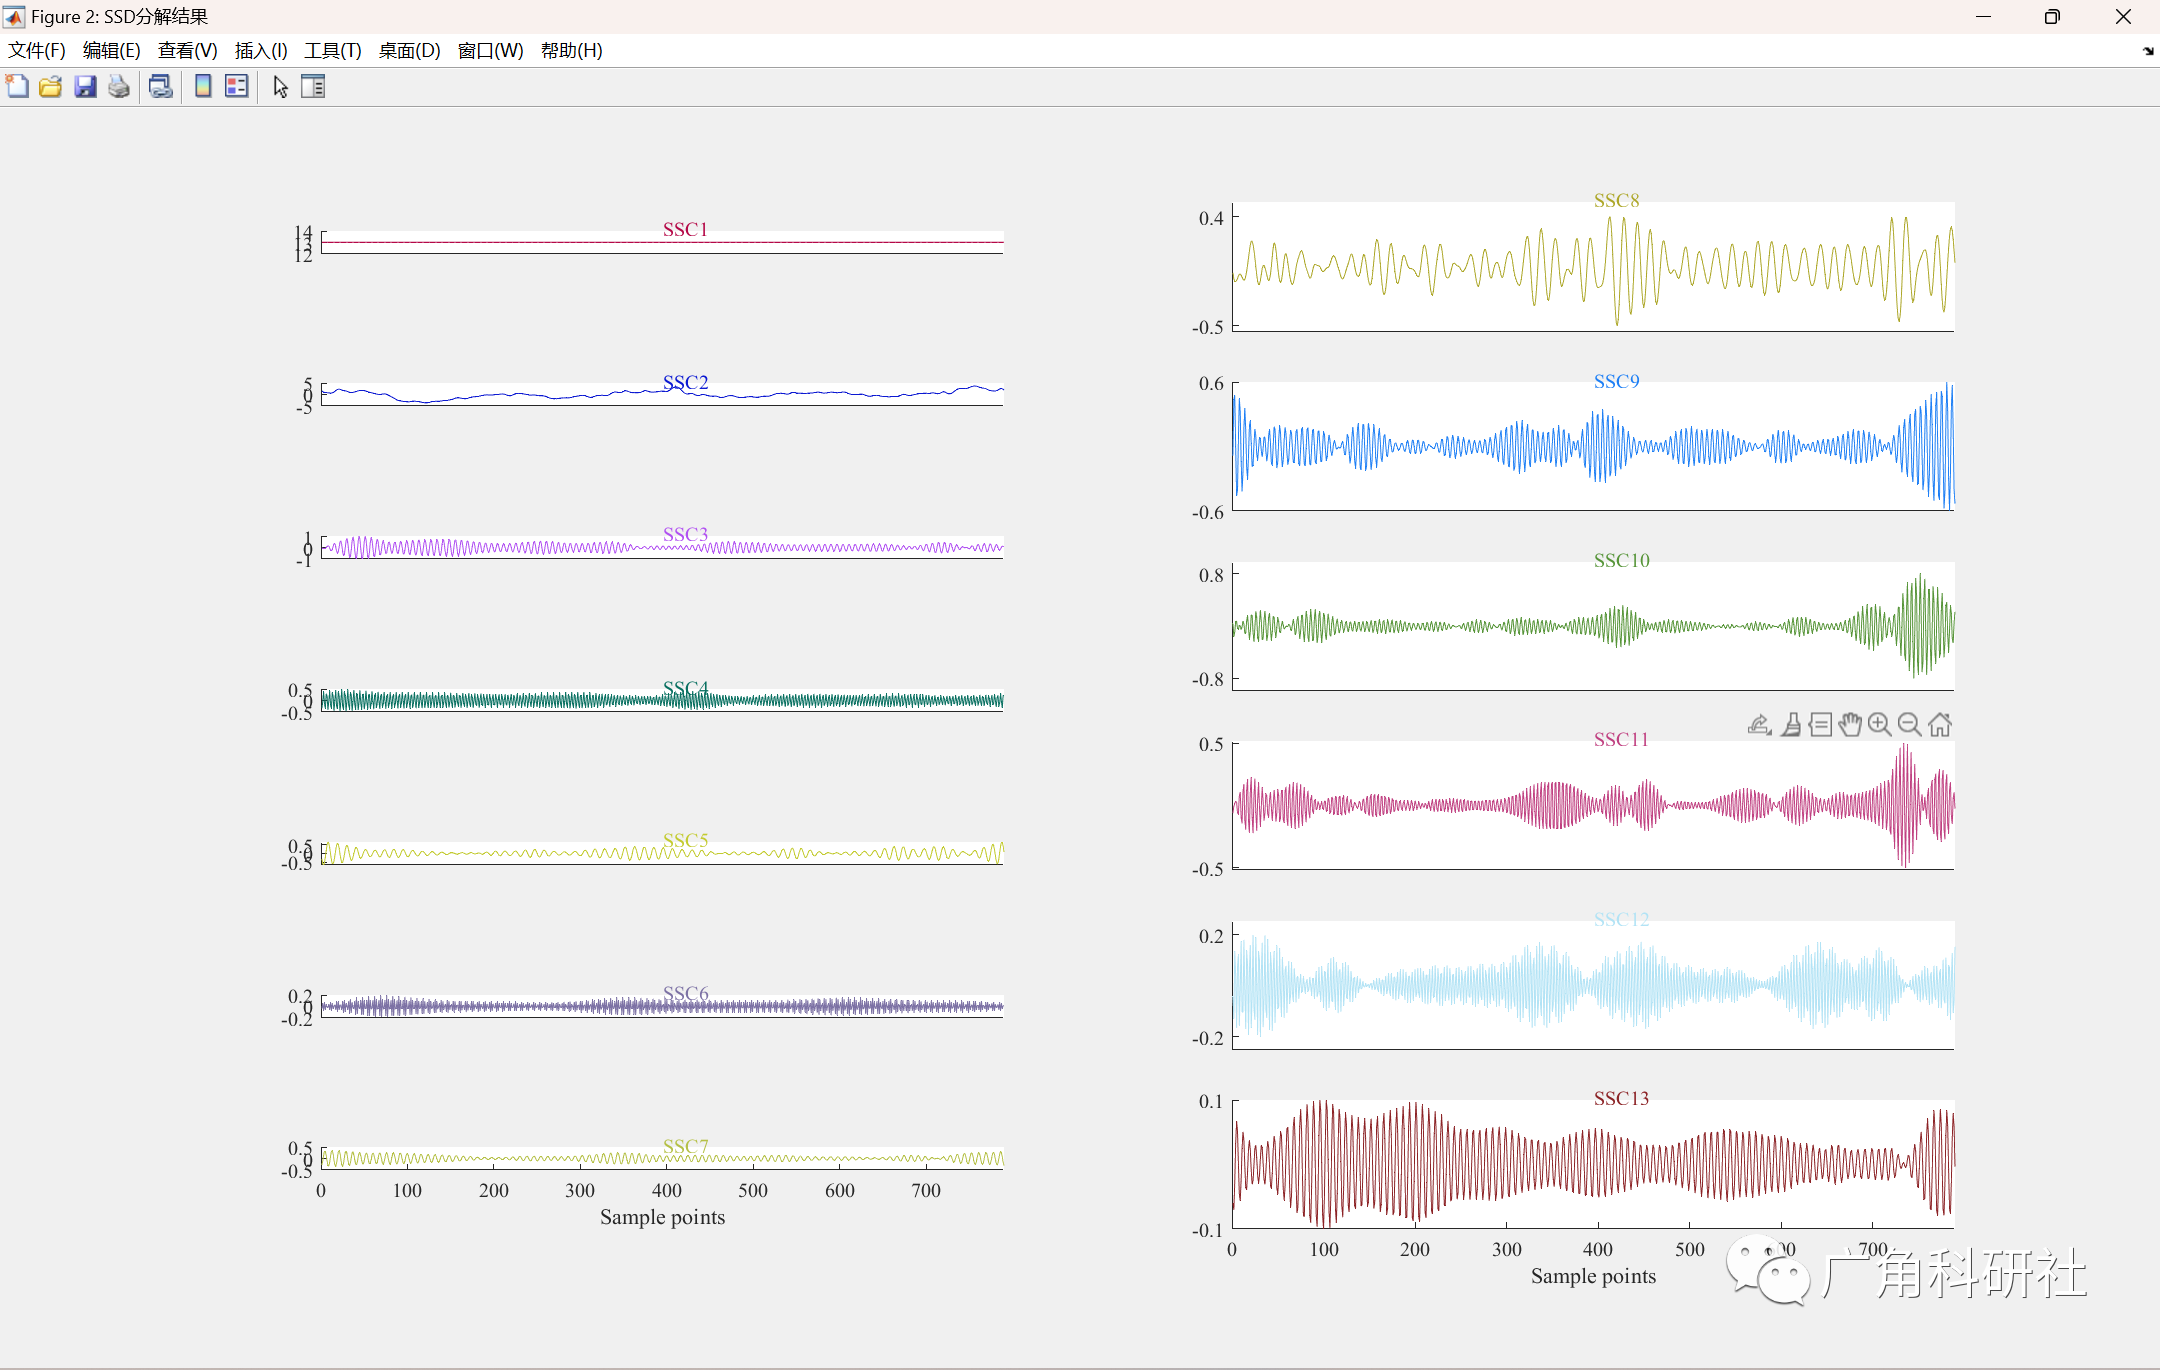
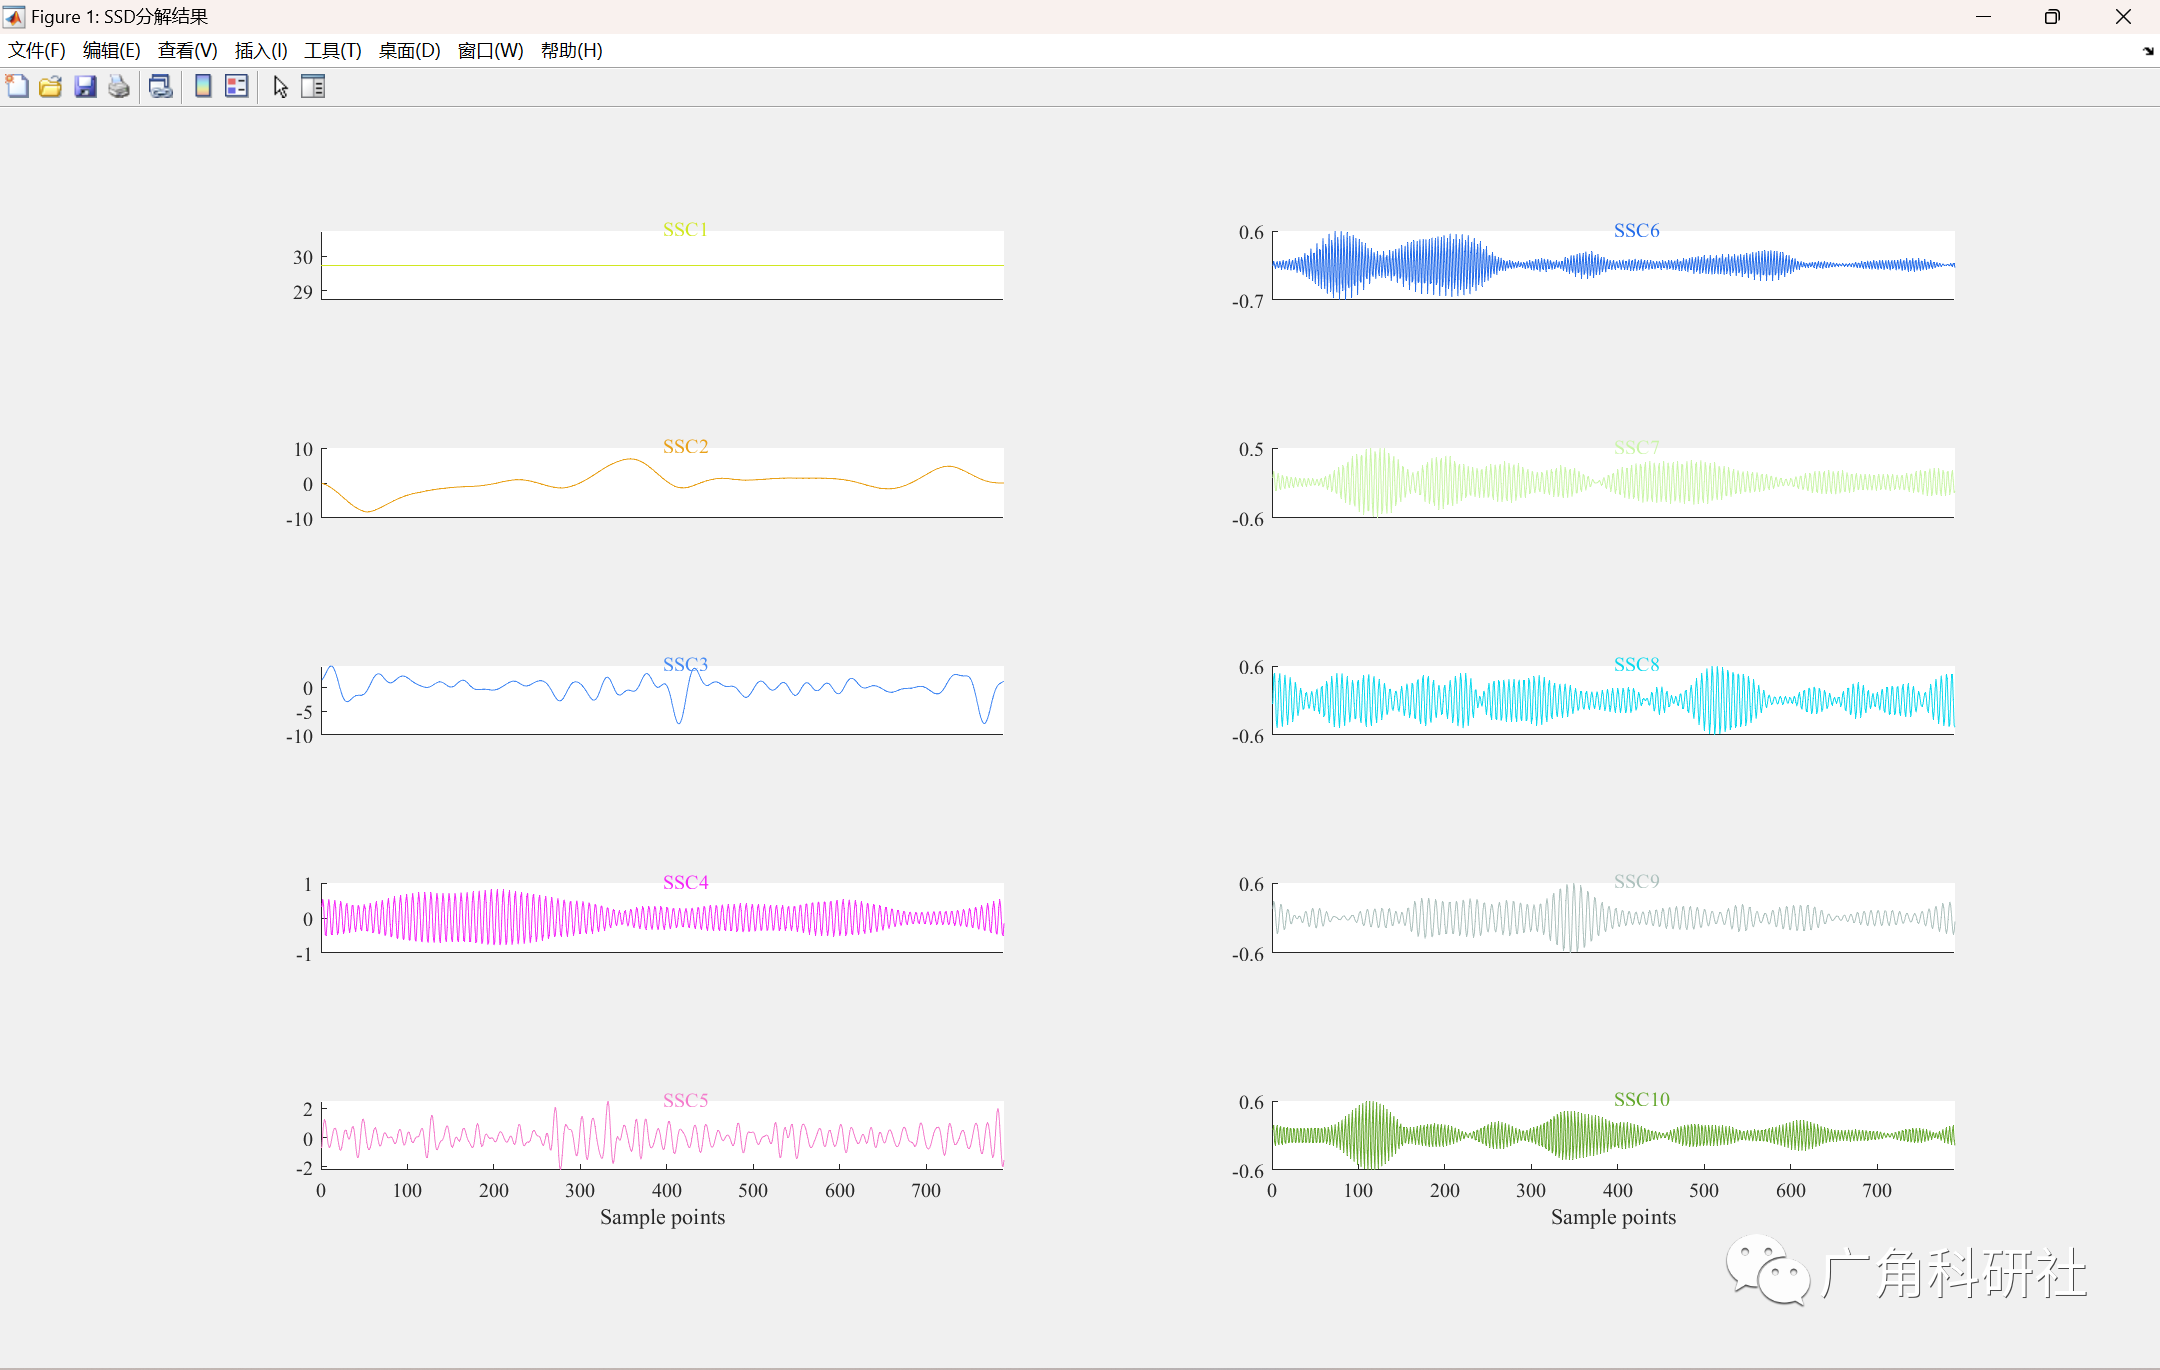
%% 中国的C-CSSD分解
load SSC_China.mat
ssc_len = length(SSC);
h3 = figure('NumberTitle','on','Name','SSD分解结果');
set(h3,'position',[378,270,603,197]);
k=size(SSC,1); %返回矩阵行数
n=round(k/2);
for i = 1:n
subplot(n,2,2*i-1);
ssc = SSC(i,:);
clor = [rand rand rand];
plot(ssc, 'Color', clor);
title (['SSC' num2str(i)], 'Color', clor, 'BackgroundColor','none', ...,'Position',[1287.50245571136,0.410722021094829,0]
'HorizontalAlignment','left', 'VerticalAlignment','middle');
xlim([0 ssc_len])
if i < n % 前m-1个分量绘图
set(gca,'xtick',[]) % set函数 将当前图形(gca)的x轴坐标刻度(xtick)标志为空
end
set(gca, 'box', 'off') % 去掉上边和右边的边框
set(gca,'FontName','Times New Roman','fontsize', 10);% 坐标轴刻度字体大小
set(get(gca,'XLabel'),'FontSize', 10);
set(get(gca,'YLabel'),'FontName','Times New Roman','FontSize', 10);
set(get(gca,'Title'),'FontSize', 10);
set(gca,'looseInset',[0 0 0 0]) % [左,下,右,上]
end
xlabel('Sample points');
for i = n+1:k
subplot(k-n,2,2*(i-n));
ssc = SSC(i,:);
clor = [rand rand rand];
plot(ssc, 'Color', clor);
title (['SSC' num2str(i)], 'Color', clor, 'BackgroundColor','none', ...,'Position',[1287.50245571136,0.410722021094829,0]
'HorizontalAlignment','left', 'VerticalAlignment','middle');
xlim([0 ssc_len])
if i < k % 前m-1个分量绘图
set(gca,'xtick',[]) % set函数 将当前图形(gca)的x轴坐标刻度(xtick)标志为空
end
set(gca, 'box', 'off') % 去掉上边和右边的边框
set(gca, 'YTick', [min(ssc) max(ssc)]);
set(gca,'YTickLabel',{num2str(min(ssc),'%.1f
'),num2str(max(ssc),'%.1f
')}); % 设置Y轴刻度值
set(gca,'FontName','Times New Roman','fontsize', 10);% 坐标轴刻度字体大小
set(get(gca,'XLabel'),'FontSize', 10);
set(get(gca,'YLabel'),'FontName','Times New Roman','FontSize', 10 );
set(get(gca,'Title'),'FontSize', 10);
set(gca,'looseInset',[0 0 0 0]) % [左,下,右,上]
end
xlabel('Sample points');
%% 美国的C-CSSD分解
load SSC_US.mat
ssc_len = length(SSC);
h3 = figure('NumberTitle','on','Name','SSD分解结果');
set(h3,'position',[378,270,603,197]);
k=size(SSC,1); %返回矩阵行数
n=round(k/2);
for i = 1:n
subplot(n,2,2*i-1);
ssc = SSC(i,:);
clor = [rand rand rand];
plot(ssc, 'Color', clor);
title (['SSC' num2str(i)], 'Color', clor, 'BackgroundColor','none', ...,'Position',[1287.50245571136,0.410722021094829,0]
'HorizontalAlignment','left', 'VerticalAlignment','middle');
xlim([0 ssc_len])
if i < n % 前m-1个分量绘图
set(gca,'xtick',[]) % set函数 将当前图形(gca)的x轴坐标刻度(xtick)标志为空
end
set(gca, 'box', 'off') % 去掉上边和右边的边框
set(gca,'FontName','Times New Roman','fontsize', 10);% 坐标轴刻度字体大小
set(get(gca,'XLabel'),'FontSize', 10);
set(get(gca,'YLabel'),'FontName','Times New Roman','FontSize', 10);
set(get(gca,'Title'),'FontSize', 10);
set(gca,'looseInset',[0 0 0 0]) % [左,下,右,上]
end
xlabel('Sample points');
for i = n+1:k
subplot(k-n,2,2*(i-n));
ssc = SSC(i,:);
clor = [rand rand rand];
plot(ssc, 'Color', clor);
title (['SSC' num2str(i)], 'Color', clor, 'BackgroundColor','none', ...,'Position',[1287.50245571136,0.410722021094829,0]
'HorizontalAlignment','left', 'VerticalAlignment','middle');
xlim([0 ssc_len])
if i < k % 前m-1个分量绘图
set(gca,'xtick',[]) % set函数 将当前图形(gca)的x轴坐标刻度(xtick)标志为空
end
set(gca, 'box', 'off') % 去掉上边和右边的边框
set(gca, 'YTick', [min(ssc) max(ssc)]);
set(gca,'YTickLabel',{num2str(min(ssc),'%.1f
'),num2str(max(ssc),'%.1f
')}); % 设置Y轴刻度值
set(gca,'FontName','Times New Roman','fontsize', 10);% 坐标轴刻度字体大小
set(get(gca,'XLabel'),'FontSize', 10);
set(get(gca,'YLabel'),'FontName','Times New Roman','FontSize', 10 );
set(get(gca,'Title'),'FontSize', 10);
set(gca,'looseInset',[0 0 0 0]) % [左,下,右,上]
end
xlabel('Sample points');
?3 参考文献
[1]陈丽君,吴君宏,张朝英,徐帅玺,吕泽焱,谭国威,赵祖亮,汪琰,宋蝶,蒋晓雁,杨伟丰.基于迭代寻优的中长期碳排放预测模型构建方法[J].统计科学与实践,2022(11):22-26.
部分理论引用网络文献,若有侵权联系博主删除。
?4 Matlab代码实现
风语者!平时喜欢研究各种技术,目前在从事后端开发工作,热爱生活、热爱工作。


站长推荐
- QT多线程的5种用法,通过使用线程解决UI主界面的耗时操作代码,防止界面卡死。
 QT多线程的5种用法,通过使用线程解决UI主界面的耗时操作代码,防止界面卡死。...
 - U8W/U8W-Mini使用与常见问题解决
 U8W/U8W-Mini使用与常见问题解决
 - stm32使用HAL库配置串口中断收发数据(保姆级教程)
 stm32使用HAL库配置串口中断收发数据(保姆级教程)
 - 分享几个国内免费的ChatGPT镜像网址(亲测有效)
 分享几个国内免费的ChatGPT镜像网址(亲测有效)
 - Allegro16.6差分等长设置及走线总结
 Allegro16.6差分等长设置及走线总结